So far I’ve given you a very small glimpse of this marvelous thing called Power BI, and the old (IT dependent) vs. the new (Self-service BI) approaches.
Let’s quickly paint a scenario: You wake up one morning and you have a beautiful red Ferrari parked in your garage (Oh yeah!!)……..but you decide to walk to work (are you mad?!). Now walking might yield some health benefits but it will take forever to get to work and you will look allot less cool. Even so, I’m not even talking about how enjoyable it will be to take this beast of a machine for a spin!!

So you’re probably asking yourself the question, “what does this have to do about Power BI or Excel”, or how I run my business. If you have seen the introduction in my previous post and you have not yet started exploring how Power BI can help you, your staff and business……….your Ferrari has never left the garage.
This is exactly why I am here, and what this post is all about – it’s about getting in your Ferrari and having the most exhilarating driving experience of your life. Besides, who wants to drive a VW Beetle or walk (Plain Excel) when you can drive a Ferrari (Power BI)?!
Exchanging your VW Beetle (or Walking) for the Ferrari
This post aims to achieve one thing, to show you the differences and benefits of using Power Pivot (and Power BI) over the traditional excel way – there really is no comparison, and soon you’ll see why. Don’t get me wrong, I love basic excel, it has been my weapon of choice for many years – In fact I don’t know what I would have done without it. But for the everyday person who needs to get the job done it could pose some problems….
- Usually, people share their Excel reports and models by emailing them to one another. This carries risk, since the data is often sensitive and formulas can accidentally become “broken”.
- When the Excel report is updated by the author or someone else there’s no real effective way to make sure everyone is using the latest version (Except maybe e-mail, but even that can get real messy).
- Thousands of ‘vlookup’ formulas to link data from different tables (not the best thing to do, and things can go wrong very quickly).
- Keeping the report up to date as requirements change is often a lot of work, especially when the number of reports grows over time (Often comes with slow, unresponsive excel files – one of the few things that will take me to the looney-bin!!!).
- If you created the file (and really the only one who knows how it works anyway) and is sick on the wrong day, business processes can completely grind to a halt – or at least you’ll have an entire business running around scrambling to generate reports they don’t necessarily understand.
- As in my first post, these reports often get their data through very clever methods that only the IT department or some IT Guru in the company is unaware of or can do. So IT often unknowingly breaks the reports by making changes to back-end systems (and then it’s the blame game for which no one really knows where things went wrong).
These things are often the reasons why there is not a great relationship between IT and business units.
So what about Power Pivot? Can it fix all our problems?
The answer is…………yes most of them! PowerPivot offers the following if compared to Excel alone:
- More powerful tools for the Excel authors. Things that used to take hours will now take minutes (or seconds), and some things that used to simply be impossible become possible.
- Your engine is fast, reliable and oh so beautiful! No more do you have limitations on the amount of data you can process, pack away those walking shoes because we are going for a ride!!
- A secure and “instant update” method for sharing the reports. No more sharing the files via e-mail or on the company shared drive (which from my experience is always down – doh!!) Now you can publish the workbook to PowerBI.com through SharePoint, OneDrive, or locally on your PC and give your users access to all those beautiful reports via he PowerBI.com web application.
- The consumers get all of the benefit, but they never download the file. Less risk to sensitive data, and when I publish a new version, everyone gets it the next time they visit the site.
- Scheduled, automatic report refresh. Oh and you decide who you want to give access to, and to what).
- You can configure the reports to automatically refresh nightly (or on any other interval) without human intervention. Less hassle for the publisher, and less risk of an outage.
- Transparency for IT. Since these reports are all stored and executing on centralized servers, IT has the ability to see what apps are out there “in the wild,” which they cannot do today. They furthermore can see which apps are being used most frequently, who is using them, and inspect them to see what systems they rely on. Again, less risk of outage.
That list of benefits typically only come with a “real” BI solution. This is why PowerPivot is often referred to as “Self-Service BI.”
Below is a diagram, compliments of PowerPivotPro showing the ‘ The Brain (and Heart!) of Microsoft’s Power BI Suite’. These guys are by the way, also my favourite source of Power Pivot info – check them out!!!
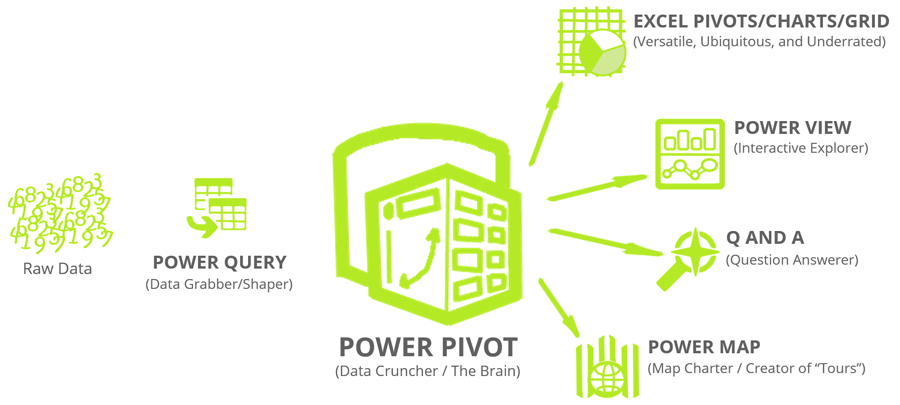
As you can see, Power Pivot is at the heart of everything. Power Query is the brother that sources (grabs), mashes (shapes) and organises the data. Once Power Pivot has analyzed the data and performed all necessary calculations, it is then visualized using excel charts / graphs, Power View, Power Map or the PowerBI.com platform. For this post, we’ll focus on Power Pivot….the engine of the Ferrari.
What you need (and what it will cost)….
This is often the BIG question most people ask when they see the fantastic things that Microsoft Power BI has developed. This might surprise you (especially if you’ve ever bought anything from Microsoft before), but most of the fantastic tools available through the Power BI offering is absolutely FREE!!! There are various configurations with Power BI (which is dependent on your organisation’s needs and requirements), but only in the case where you want the Rolls Royce of Power BI – where you have to pay a fee to be a Power BI Pro user (by the way, it’s still very cheap). But for most people, even for small businesses, the free version will do everything you want and more. So what do you need?
- Excel 2003\7: Not supported by any of the Power BI software (time to upgrade).
- Excel 2010: Many business still use this version, and that’s OK – but you’ll be limited to Power Pivot for Excel 2010 and Power Query. This is not bad news, these two tools have Power which will blow your mind completely.
- Excel 2013: The Excel 2013 (Professional Plus, Office 365 ProPlus or Excel 2013 Standalone) version now comes standard with Power Pivot, Power Map, Power View built-in, so just Power Query needs to be installed.
- Excel 2016: The Excel 2016 version comes standard with the whole package (but is named different things – we’ll get to this later.)
Want to install these software, go here and choose your version of excel and download.
Start your engines (Vroooooooommmm!!!!)
So at this point in time you probably want to see the benefits of using Power Pivot (physically), right?
Let’s jump right in…..In this video we are going to compare two “report generating” approaches using a data set extracted from SAGE 300 ERP (Thanks to my friend and UK based Power BI partner Johann Joubert from Data Bear!!). By the way…..if your business is using SAGE, Pastel, Xero etc. do yourself a favour and give Data Bear a call!!!
What is SAGE 300 ERP?
“Sage 300 ERP is the name for the mid-market Sage ERP line of enterprise management and accounting applications (formerly Sage ERP Accpac), primarily serving small and medium-sized businesses.”
Although we have just scratched the surface here, you’re probably so excited to get Power BI going that you want to wee in your pants………..OK maybe that’s just me, but still, it’s probably the most exciting thing you’ve seen since, well……sliced bread!!
If you want to learn how to do these things on your own (which takes time, but well worth the effort), just follow my post and linked resources and you’ll get there in no time at all. If you don’t have the time or energy and want someone to come and implement a solution that suits your business………..give me a call!! We also do demonstrations of the Power BI package for different types of businesses, so you can see to some degree what is possible for your own business.
So there you are, another fun-filled adventure, jam packed with cool sports cars and excitement has come to an end. But as you already know, this is clearly not the end…………..this is just the beginning of your journey.
So until next time…..
“May the Power BI with you!!”
Llewellyn Holtshausen (aka Llew)
Polymath Consulting (Pty) Ltd
+27810274991
